Project 1
Collect data from zillow to train a model that predicts home price.
- For reference watch What is ML by Laurence Maroney, beginning at about minute 8 with the subsequent housing price exercise presented at the end of the video. You are also welcome to refer to the beginning part of the second video in this series First steps in computer vision, where the solution to the example housing price exercise is presented.
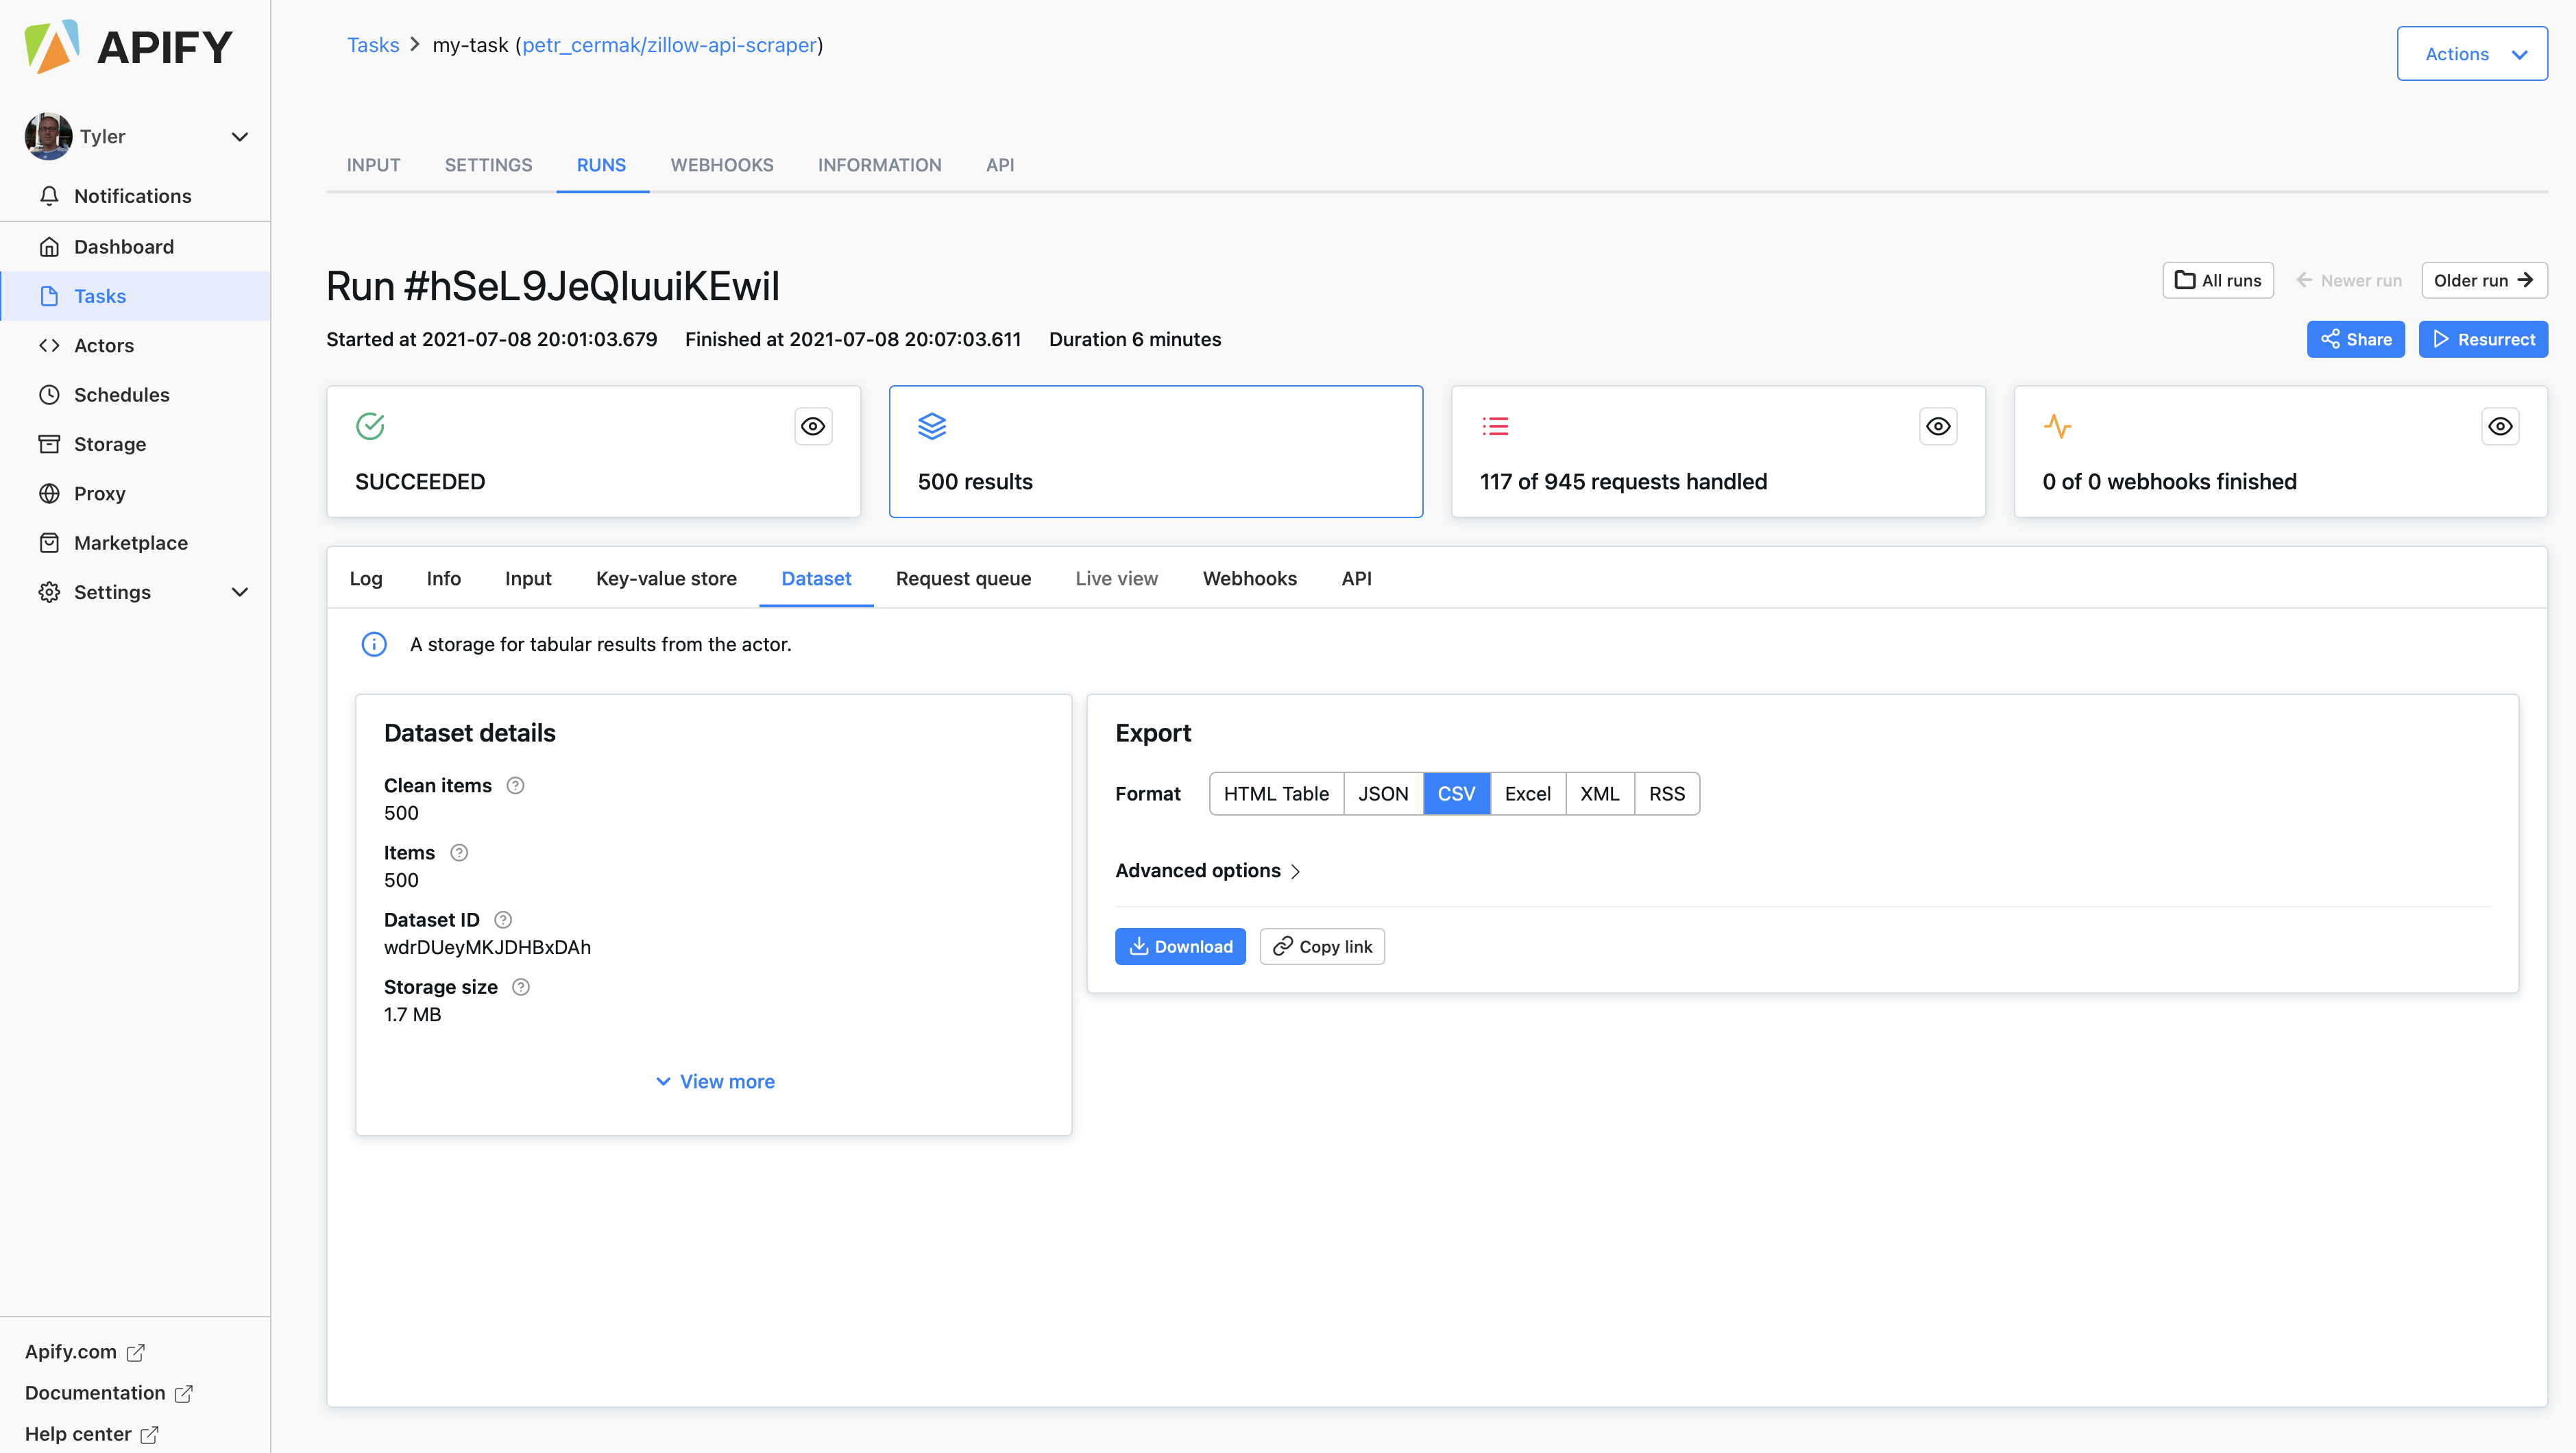
- Got to the Apify zillow scraper and scrape a few hundred home sale listings from any city. Download the file as a
.csv.

-
Use the pandas
read_csv()function to import your file to your PyCharm session. Create a data frame that has the following variables.- price
- bedrooms
- bathrooms
- livingArea
-
Check if your data frame has any NaN values and drop them in place as needed.
-
As in the above referenced example, scale the living area and price values. Check the shape of your input data in preparation for specifying your model.
-
Pipe the data to your model as follows.
model = tf.keras.Sequential([keras.layers.Dense(units=1, input_shape=[3])])
model.compile(optimizer='sgd', loss='mean_squared_error')
history = model.fit(X, y, epochs=100)
-
Use
model.predict()to predict the price of each home using the input variables -
Inverse transform these values (the opposite of where you scaled the price above) and add them as a new column in your data frame.
-
Use the following to plot model loss.
plt.plot(history.history['loss'], label='loss')
plt.ylim([add, add])
plt.xlim([add, add])
plt.xlabel('Epoch')
plt.ylabel('loss')
plt.legend()
plt.grid(True)
plt.show()
- Use the following to plot the asking price and predicted price for all of the homes in your selected city
plt.scatter(your_dataframe['add_variable'], your_dataframe['add_variable'])
plt.xlim([add, add])
plt.ylim([add, add])
plt.axline([0, 0], [1, 1])
plt.xlabel('add_label')
plt.ylabel('add_label')
plt.legend()
plt.show()
- Produce the MSE for your model using the following.
mse = np.mean((y - y_pred) ** 2)
mse
-
Answer the following questions.
- How did your model fare?
- In your estimation is there a particular variable that may improve model performance?
- Which of the predictions were the most accurate? In which percentile do these most accurate predictions reside? Did your model trend towards over or under predicting home values?
- Which feature appears to be the most significant predictor?